A Performance Comparison of Microsoft Excel and Python for Tabular Data Analysis
DOI:
https://doi.org/10.29304/jqcsm.2026.18.12585Keywords:
Python (Pandas), Microsoft Excel, Data Analysis, Performance Evaluation, Execution TimeAbstract
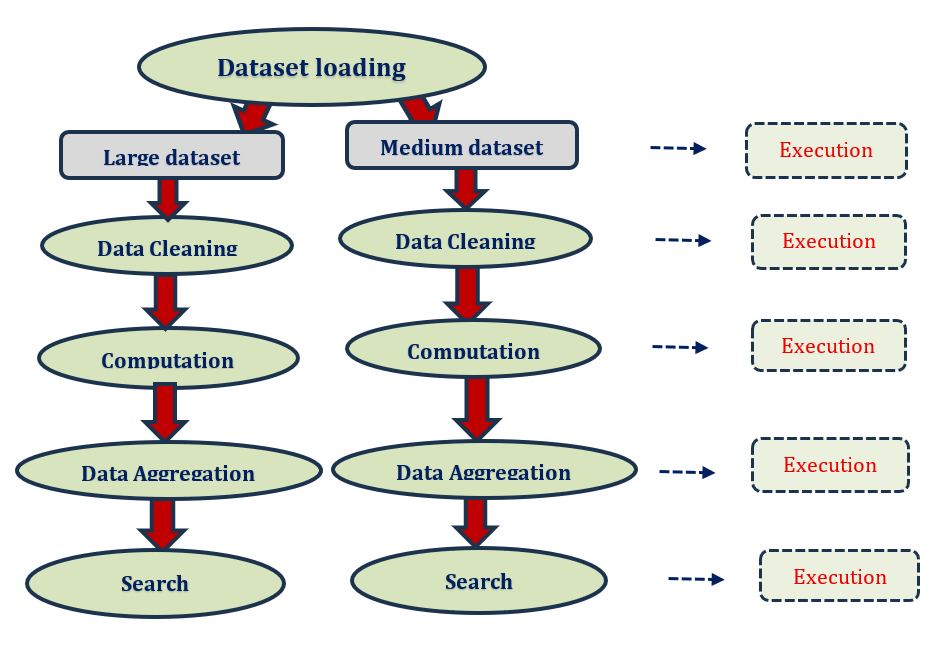
Microsoft Excel is commonly treated as a simple spreadsheet program that is mainly applied to do simple calculations, and Python has become a common solution to complex data analysis based on the programming language. In this work, a technical performance analysis of Microsoft Excel and Python (Pandas) is provided as an attempt to assess their compatibility with basic data analysis functions. The comparison is done which consists of loading datasets, cleaning data, calculating features, aggregating and searching them. The main performance parameter used is execution time and measurements are taken at every processing phase so as to provide a detailed and equitable evaluation. To ensure a robust assessment, the methodology utilized two distinct transactional datasets: a medium-scale over 500000 records and a large-scale dataset over one million records. A key contribution of this work is the implementation of a search loop algorithm as a stress test, where execution time was measured for three specific scenarios: searching for a record at the beginning, at the end, and for a non-existent value. According to the experimental findings, Excel can efficiently handle all of the analyzed tasks and its execution time is as approximate Python as both systems are able to complete the tasks in an approximate time interval. Despite Python having more accuracy in procedures and measurements of time, more automation, and higher reproducibility due to code-based workflows, Excel has competitive analytical capabilities in interactive processing of data. These results underscore the idea that Microsoft Excel can no longer be viewed as an exclusively computational device, and instead of that, it can be viewed as a technically competent data analysis platform capable of performing similarly to Python on large-scaled analytical workloads.
Downloads
References
Provost, F., & Fawcett, T. (2013). Data Science for Business. O’Reilly Media.
Walkenbach, J. (2015). Excel 2016 Bible. Wiley.
Alexander, M., & Kusleika, D. (2018). Excel 2019 Power Programming with VBA. Wiley.
Orhani, S. (2025). Comparative analysis of statistical results generated by Python, R, SPSS, and Excel. International Journal of Progressive Research in Engineering Management and Science.
McKinney, W. (2012). Python for data analysis. O’Reilly Media.
VanderPlas, J. (2016). Python Data Science Handbook. O’Reilly Media.
McKinney, W. (2010). Data structures for statistical computing in Python. Proceedings of the 9th Python in Science Conference, 51–56.
Wang, S.-F. (2024). The secret behind Big Data – Data Science. CASE, National Taiwan University.
https://case.ntu.edu.tw/blog/?p=43964.
Chen, H., Chiang, R. H., & Storey, V. C. (2012). Business intelligence and analytics. MIS Quarterly, 36(4), 1165–1188.
Sarker, I. H. (2024). Data science and analytics: Tools, techniques, and performance considerations. SN Computer Science, 5(1), 1–22.
McKinney, W. (2011). Data structures for statistical computing in Python. Proceedings of the 9th Python in Science Conference, 51–56.
McKinney, W. (2018). Python for Data Analysis: Data Wrangling with Pandas, NumPy, and IPython (2nd ed.). O’Reilly Media.
Chen, J., Li, Y., & Zhang, H. (2022). A comparative study of spreadsheet tools and Python-based frameworks for data analysis efficiency. Journal of Big Data, 9(1), 1–18.
Knaflic, S. N., & Few, S. (2023). Modern data analysis workflows: From spreadsheets to programming-based tools. IEEE Access, 11, 45678–45690.
Panko, R. R. (2015). What we know about spreadsheet errors. Journal of End User Computing, 10(2), 15–21.
Van der Aalst, W. (2016). Data Science in Action. Springer International Publishing.
Alteryx Research Team. (2020). Excel vs Python for Data Analytics. Alteryx Inc.
McKinney, W., & Pandas Development Team. (2020). Pandas Documentation. Available online.
The Online Retail dataset was obtained from the UCI Machine Learning Repository.
Microsoft. (2023). Analyze data with Excel PivotTables. Microsoft Documentation.
Few, S. (2022). Information Dashboard Design: Displaying Data for At-a-Glance Monitoring. Analytics Press.
Chen, H., Chiang, R. H., & Storey, V. C. (2023). Business intelligence and analytics: trends and future directions. MIS Quarterly.
McKinney, W. (2023). pandas: powerful Python data analysis toolkit. Pandas Documentation.
VanderPlas, J. (2023). Python Data Science Handbook (2nd ed.). O’Reilly Media.
Orhani, S. (2025). Comparative analysis of statistical results generated by Python, R, SPSS, and Excel. International Journal of Progressive Research in Engineering Management and Science.
Downloads
Published
How to Cite
Issue
Section
License
Copyright (c) 2026 Basma Mustafa M. H

This work is licensed under a Creative Commons Attribution-NonCommercial-NoDerivatives 4.0 International License.